
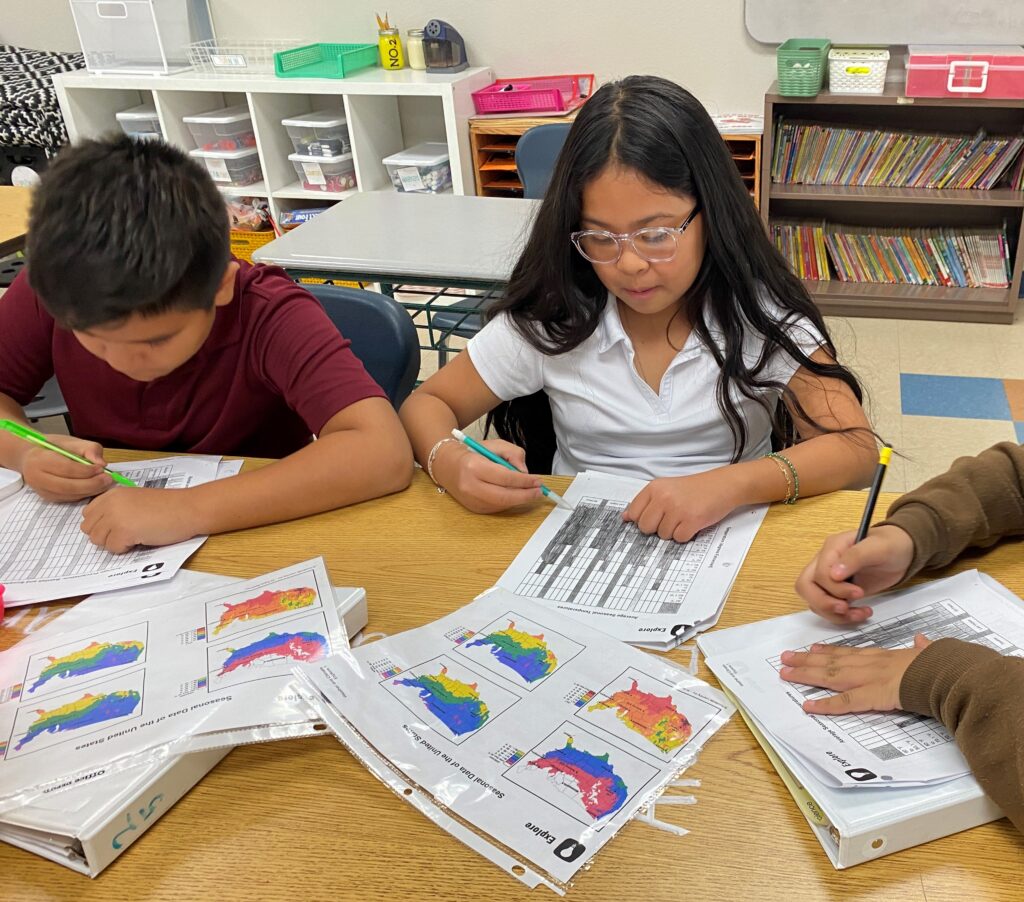
In 4th and 5th grade we started by talking about temperature and precipitation. Student looked at maps and had to graph the average seasonal temperatures in many different cities. Then they looked at other maps to graph the precipitation (average rainfall and snow) in the same cities. Students used this information to figure out the climate of each location. They did a great job comparing cities, thinking about our climate here in Arizona, and making the connections between weather and climate!
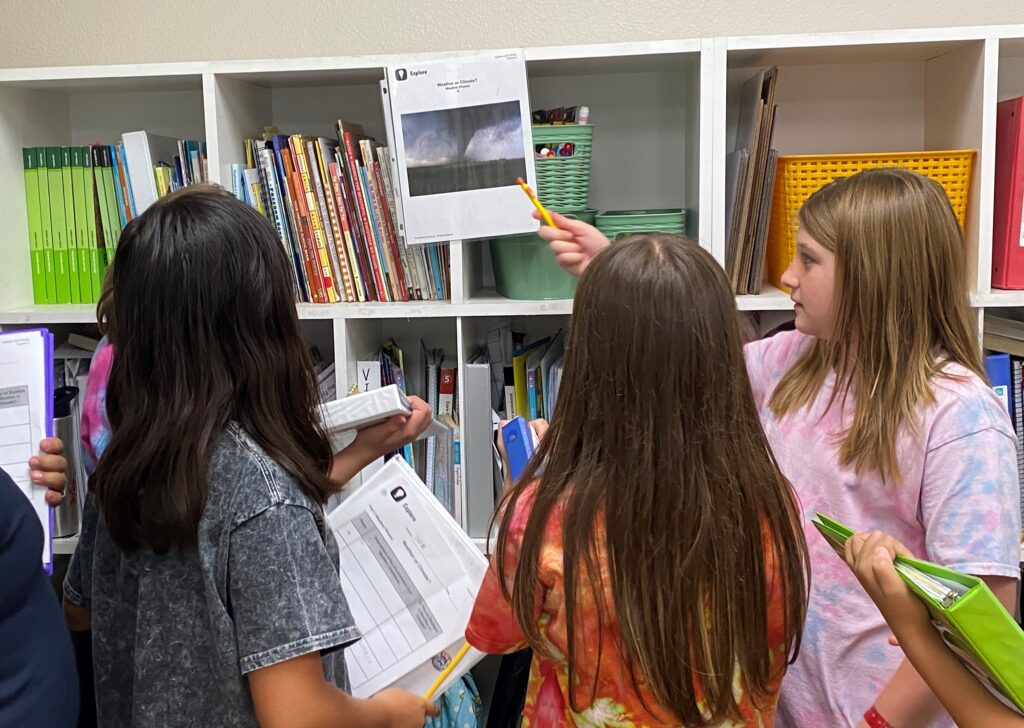
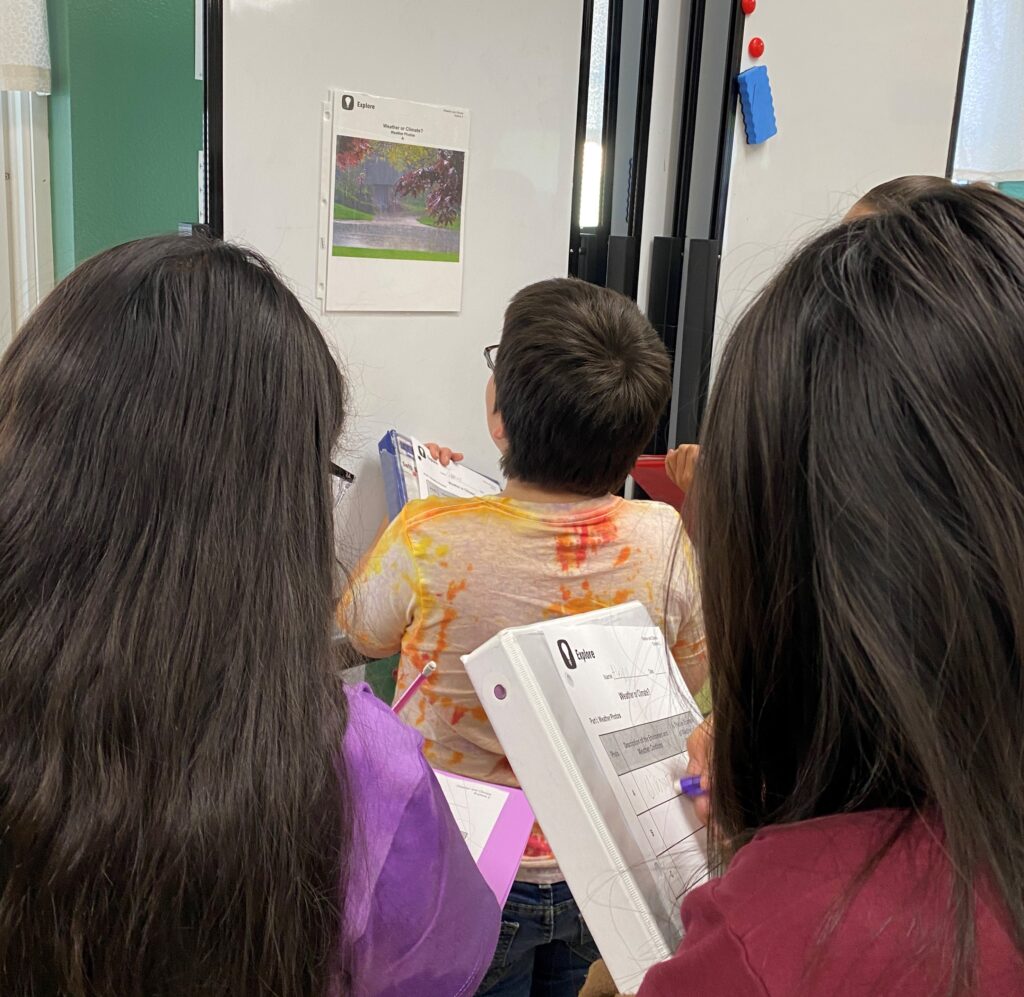
Students looked at 5 different pictures, had to observe what they see and write observations, then decide if the picture is showing weather or climate. They did a great job using the pictures to figure it out!
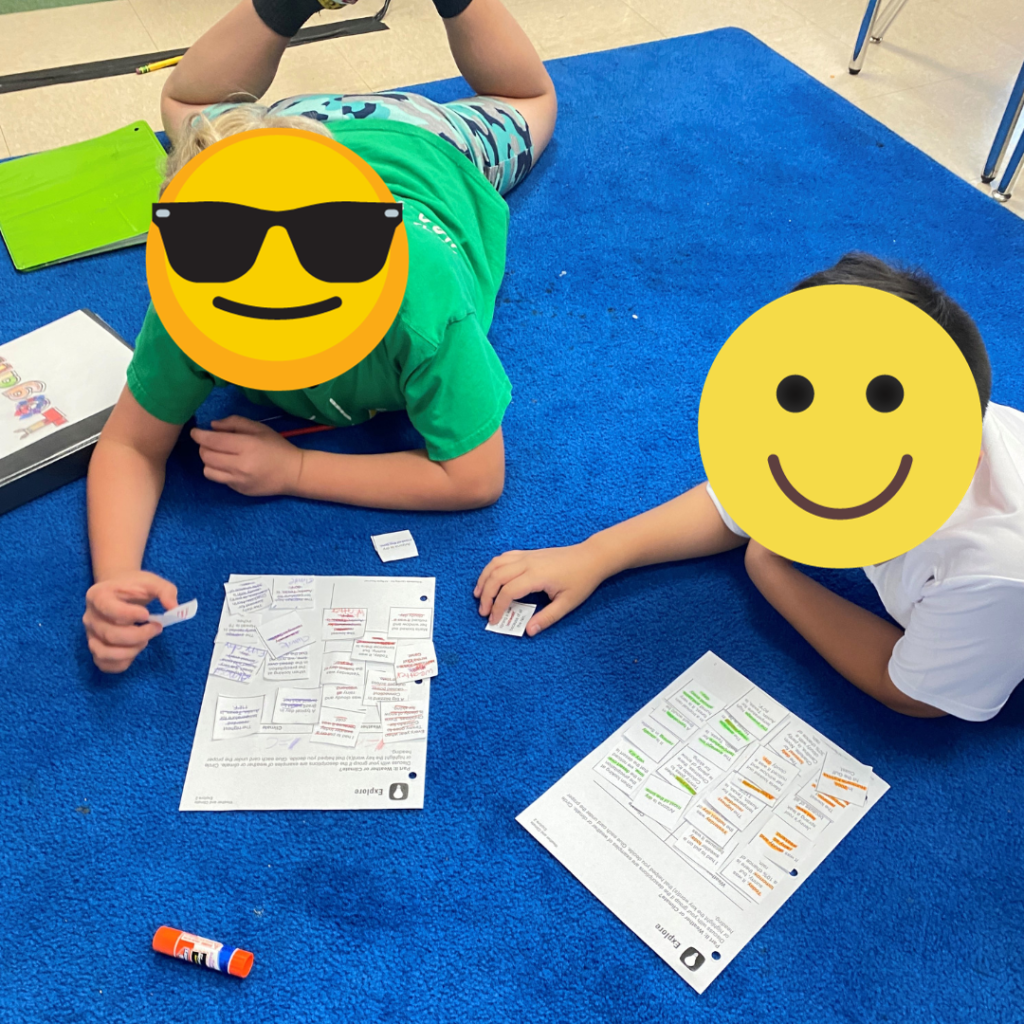
To figure out the difference between weather and climate, we made some anchor charts with key words. Weather is short term, what is happening now, and includes storms. Climate is the the average temperature and precipitation based on years on weather information. Students had 20 situation cards. They highlighted key words, then worked with a partner to sort, deciding which were about weather and which were climate.
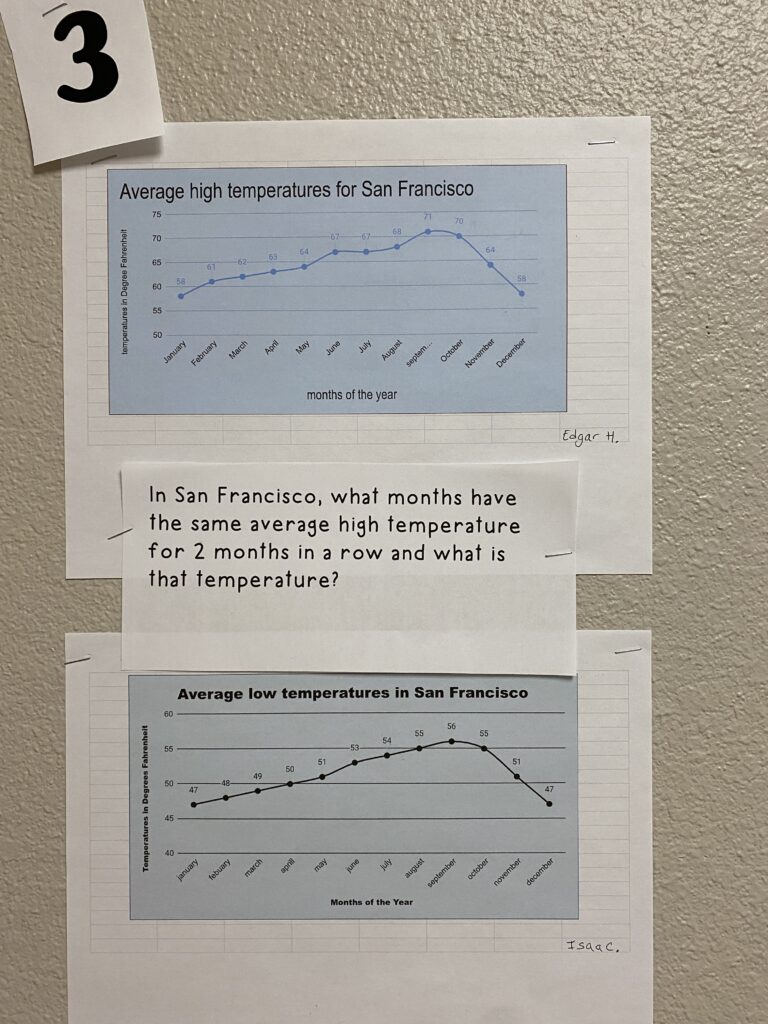
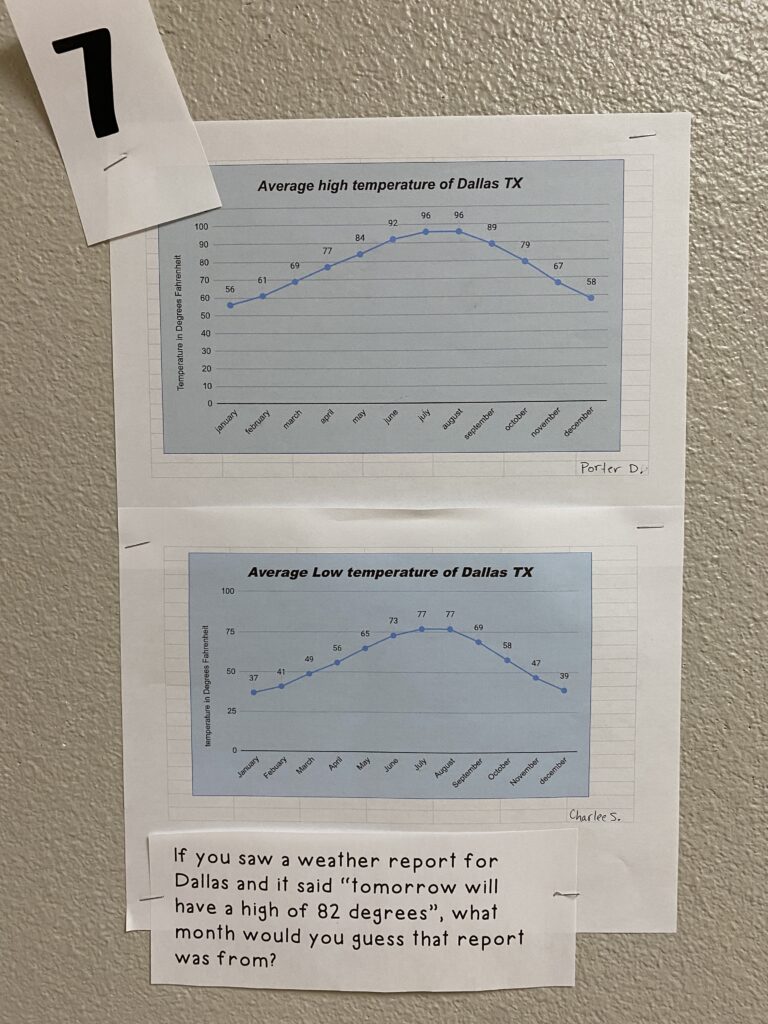
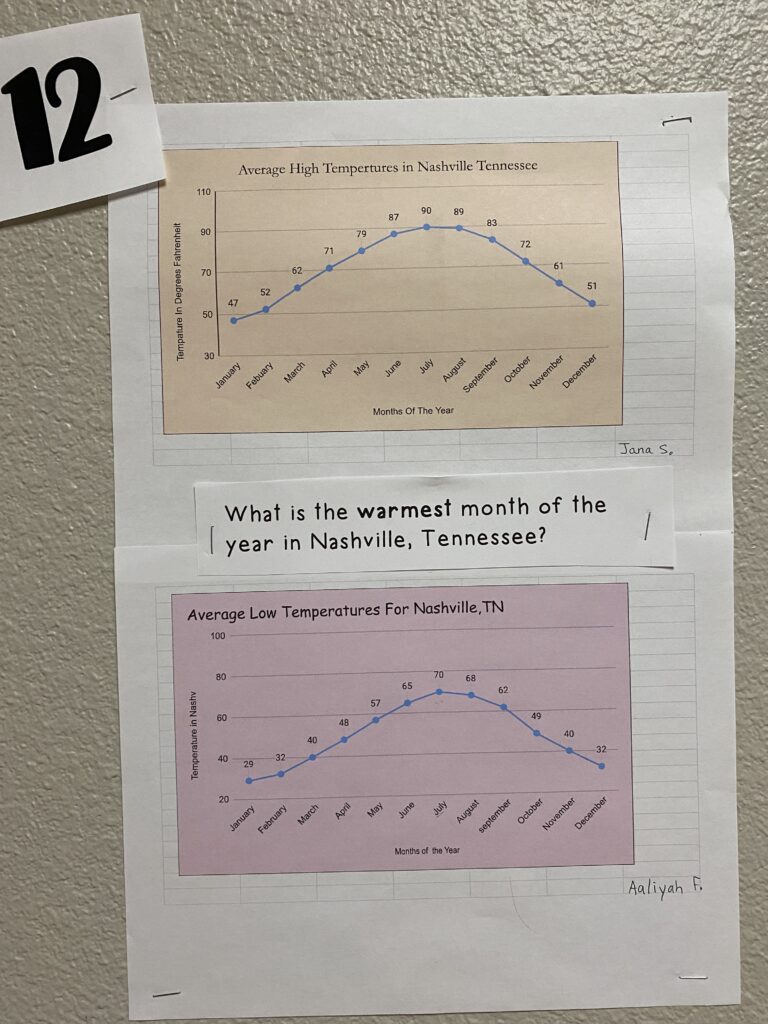
Students got to make a line graph in Google Sheets. They chose a city and were given the average high and low temperatures for each month. They worked with a partner, one making a graph that shows the high and the other showing the low temperatures. Then we answered questions based on those graphs!
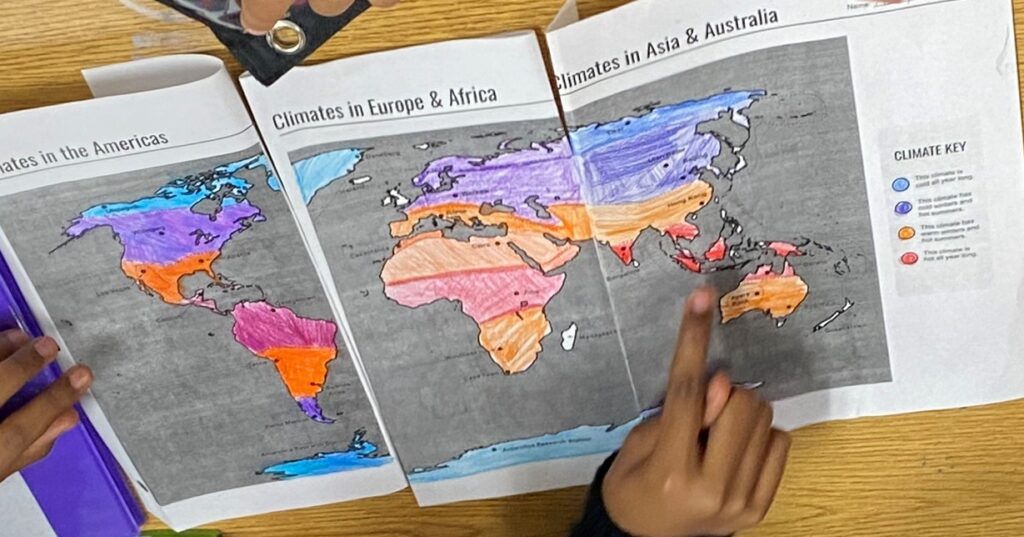
Next, students figured out all the climates of the world by looking at temperatures of cities across the Earth and then finding the patterns. They learned that the Tropical climate is near the equator, where they get direct sunlight all year long. They also learned about the Polar, Temperate, Mild, and Desert climates.
Note: I only added photos of students who have returned the photo release form. The students with the emojis have not returned the form yet.